Reporting vs Analytics: When to Use Each in Subscriptions
Reporting vs analytics for subscription stores: what each answers, which metrics belong in reports, and when to analyze churn, cohorts and LTV.
Reporting vs analytics for subscription stores: what each answers, which metrics belong in reports, and when to analyze churn, cohorts and LTV.
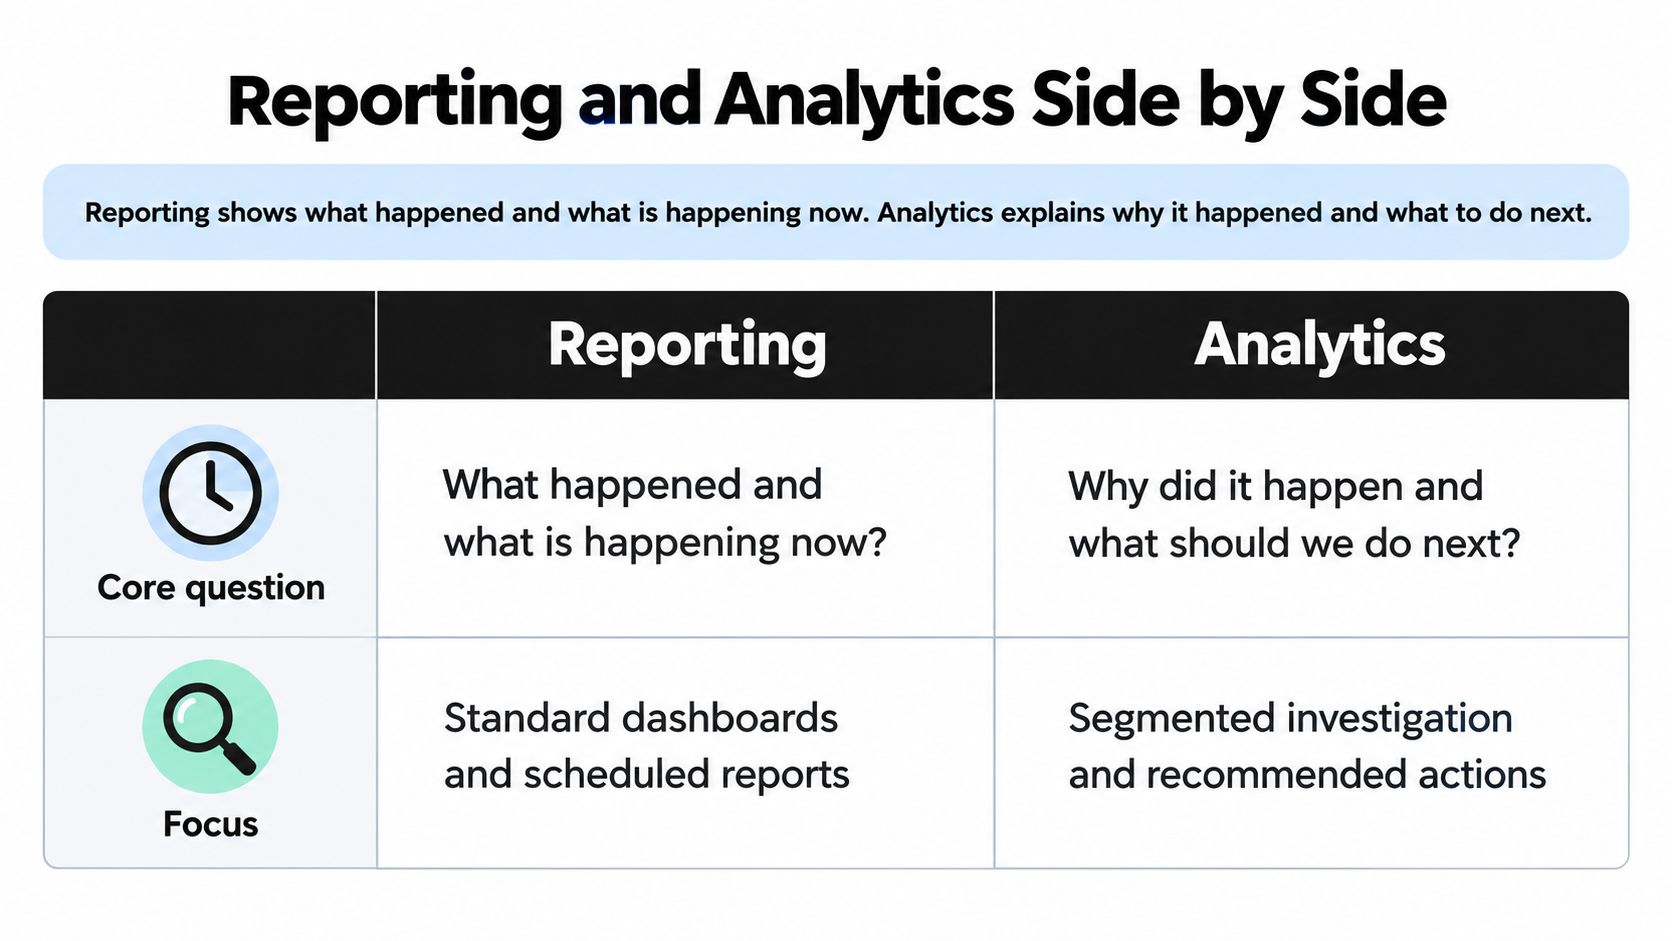
Reporting shows what happened and what is happening now, while analytics explains why it happened and what to do next. But the popular advice to graduate from reporting to analytics skips the harder question: do your numbers mean what your team thinks they mean?
For a subscription store, counting a pause as churn or a payment retry as a new renewal can change both the dashboard and the recommended action. The useful distinction in reporting vs analytics isn't sophistication. It's whether you need a repeatable measurement or an investigation, and whether the underlying definitions can support either.
Table of Contents
- Reporting and Analytics Side by Side
- Standard Reports Every Subscription Store Runs
- Metric Definitions That Change the Answer
- Where Analytics Goes Beyond the Report
- Choosing Reporting, Analytics or Both by Situation
- Tools and Queries for Each Layer
- Build the Reporting Layer Before the Analysis
Reporting and Analytics Side by Side
Reporting vs analytics on the same criteria
| Dimension | Reporting | Analytics |
|---|---|---|
| Core question | What happened, and what is happening now? | Why did it happen, what comes next, and what should we test? |
| Typical output | Recurring tables, dashboards and KPI summaries | Segmented analyses, cohort studies, forecasts and experiment readouts |
| Time orientation | Historical and current | Historical, with forward-looking estimates |
| Typical user | Finance, operations and support leads | Growth, retention and lifecycle analysts |
| Subscription example | March MRR and failed-payment count | Churn split by billing interval, cohort and acquisition source |
| Standardization | Fixed definitions repeated every period | Exploratory questions and methods, with stable metric definitions |
These are complementary jobs, not competing levels of competence. IBM's business analytics overview describes business intelligence as the broader infrastructure for collecting, managing and presenting organizational data, with business analytics applying statistical and computational methods to identify patterns and support forward-looking decisions.
That framing matters because an analyst shouldn't have to rebuild the financial baseline before investigating retention. Reporting supplies agreed measurements; analytics examines relationships within them.
The same business, different questions
Say a coffee subscription store reviews March MRR and its failed-payment count. The report establishes the period's recurring revenue position and the payment workload.
The analyst then splits churn by billing interval and acquisition source. That investigation can distinguish a change in customer mix from deterioration within a particular segment, which calls for a different response.
The distinction is easier to keep visible when both layers sit side by side.
When evaluating automated reporting workflows, the MyMentions guide to AI reporting is a useful companion resource. Evaluate generated summaries against the same distinction: describing a movement isn't the same as explaining its cause.
A dashboard with many charts isn't automatically analysis. Equally, a predictive model built on unstable definitions isn't insight.
Standard Reports Every Subscription Store Runs
Core subscription metrics and their reporting and analytical cuts
| Metric | Reporting question | Analytical cut |
|---|---|---|
| MRR | What is our monthly-normalized recurring revenue? | MRR bridge separating new, expansion, contraction and churned revenue by cohort |
| Active subscribers | How many subscriptions are active today? | Active counts by plan interval, bundle and tenure |
| Churn rate | What share of the starting subscriber base cancelled or lapsed this period? | Voluntary versus involuntary churn, by reason and cohort |
| Failed payments | How many renewals declined, and how many recovered? | Recovery rate by decline type and retry window |
| AOV | What was average order value on renewals this period? | AOV by bundle, discount tier and product mix |
| ARPU | What revenue did each active subscriber generate this month? | ARPU trend by cohort age |
| LTV | What lifetime value has been booked to date? | Projected LTV from cohort retention curves |
A reporting metric earns its place by answering a recurring operational question. Keep its definition fixed between reviews so the team can compare periods without first debating the calculation.
NIST's data and analysis guidance recommends selecting a limited set of measures aligned with organizational objectives, balancing financial, operational, customer and workforce indicators, and reviewing them through repeatable processes. For subscription operators, that means resisting the temptation to turn every available field into a headline KPI.
Read the measure, not just the label
MRR isn't just the cash collected during a month. Normalize recurring commitments to a monthly basis, and keep that view separate from payment receipts and accounting revenue.
Active subscribers also needs a clear unit. If the report counts subscriptions rather than unique customers, label it accordingly, especially when customers can hold multiple subscriptions.
The remaining metrics need equally explicit boundaries:
- Churn rate: Show the numerator and starting population alongside the rate. A cancellation count alone doesn't describe the share lost.
- Failed payments: Separate declined attempts from affected renewals, because retries can create multiple attempts against the same obligation.
- AOV and ARPU: Use orders as the denominator for AOV and the defined subscriber population for ARPU.
- LTV: Label observed revenue to date separately from projected future value, and state whether value means revenue or contribution margin.
Use a subscription metrics and KPI reference to document the operating scorecard, not to expand it indiscriminately.
Match the review to the decision
Today's active subscriptions, retry queue and renewal failures belong in the operational view. Assign an owner who can act on exceptions rather than merely acknowledge them.
Practical rule: Refresh and review a metric at the pace required by its next decision, not because every dashboard uses the same schedule.
Payment recovery needs current status. A monthly MRR measure can be reviewed weekly to monitor movement, provided the team understands that the period remains open.
Metric Definitions That Change the Answer
Analytics isn't automatically superior to reporting. When definitions are unstable, a more elaborate method can turn a classification mistake into a confident recommendation.
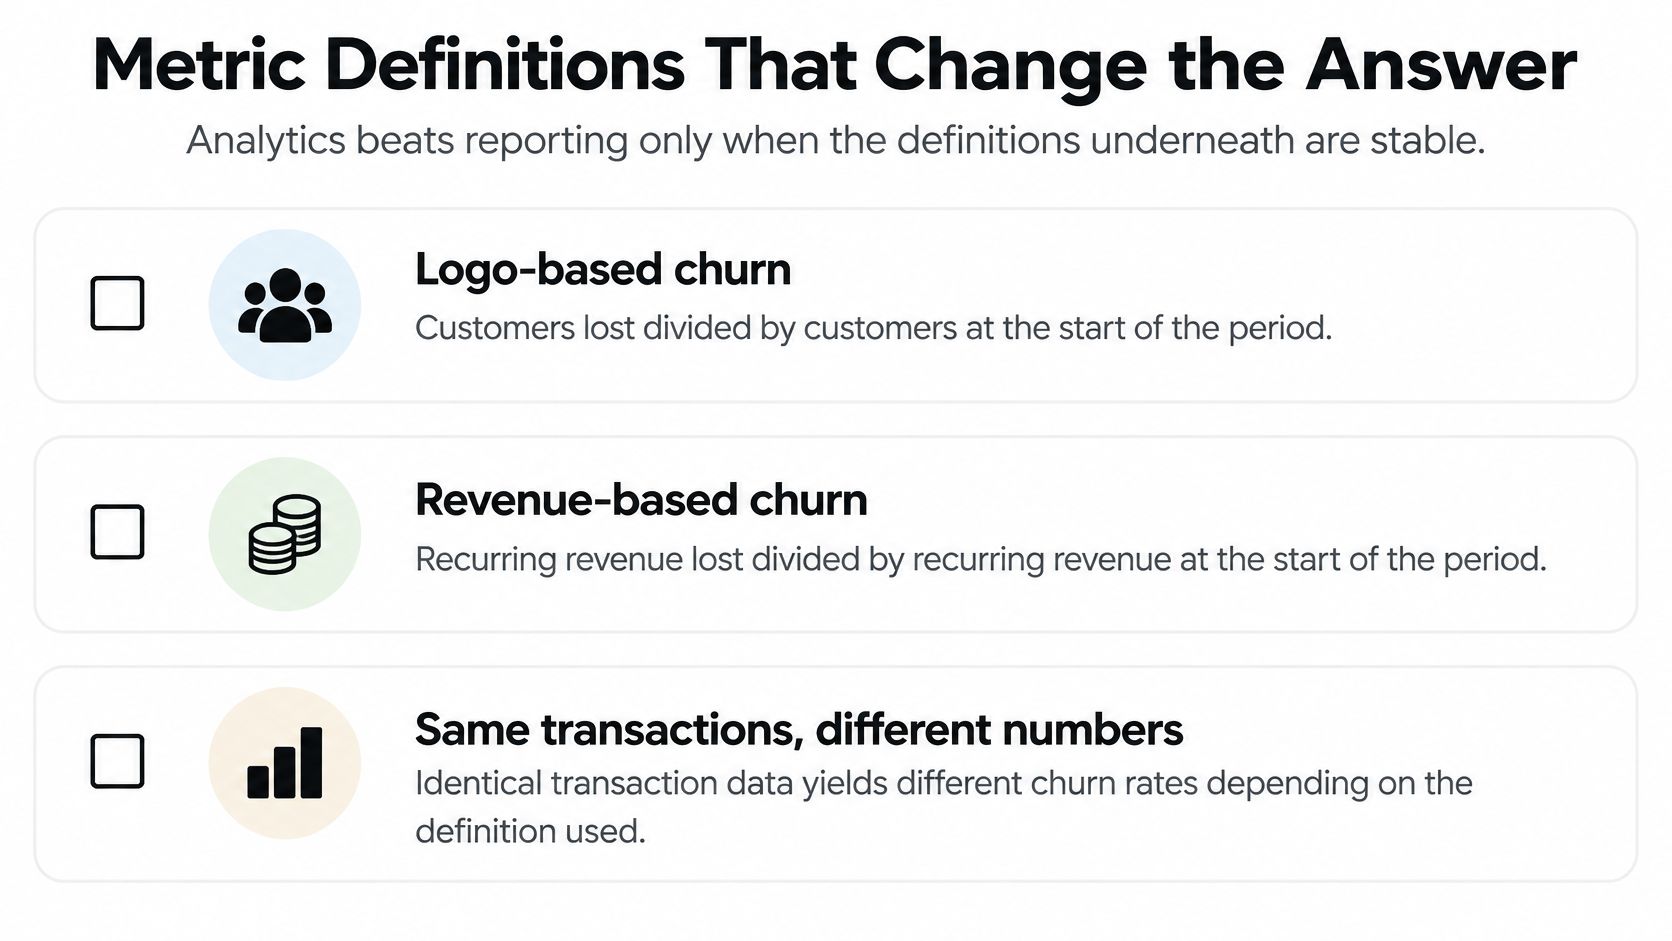
Consider churn. Logo-based churn counts lost customers, subscription-based churn counts lost subscriptions, and revenue-based churn measures lost recurring revenue. These answer different questions even when they use identical transactions.
Keep those units visible before comparing results.
Write a metric contract
A metric contract records the rules that make a number reproducible. It should specify:
- Time boundaries: Event timestamp, reporting timezone, effective cancellation date and billing-period treatment.
- Subscription states: Whether pauses, skips, pending cancellations and expired prepaid terms remain active.
- Payment outcomes: How retries, recovered renewals, refunds and chargebacks affect the measure.
- Comparability rules: Currency conversion, cohort entry, attribution windows and treatment of late-arriving events.
Say a paused subscriber is classified as churned and later resumes. The system can then show a loss followed by a reactivation without any permanent customer departure. An analyst who interprets that sequence as successful win-back activity would recommend the wrong intervention.
Require evidence before interpretation
Apply these checks before releasing a report for decisions:
- Reconcile records: Match subscriber movements to subscription events, orders and payments, explaining legitimate timing differences.
- Check cohort completeness: Confirm that every included cohort has had the opportunity to reach the renewal stage being compared.
- Separate exit mechanisms: Distinguish customer-initiated cancellation from payment-related lapse and unresolved recovery.
The organizational concern is substantial. In BARC's global 2025 survey of 1,795 data and analytics professionals, data security ranked first and data-quality management second among priorities.
Similarly, Evanta's 2024 CIO survey found that 76% of CIOs named enabling data-driven decisions as their primary data-and-analytics goal, while 54% identified data quality and availability as the main obstacle.
For a complementary visual explanation, use the video alongside your own metric contract.
Apply the same discipline to acquisition labels. Rankira's guide to understand your Shopify store's search performance provides context for that adjacent workflow; retention analysis still needs a declared attribution window before comparing acquisition sources.
A churn model trained on inconsistent cancellation or recovery labels learns those inconsistencies. The contract and reconciliation checks come before the model.
Where Analytics Goes Beyond the Report
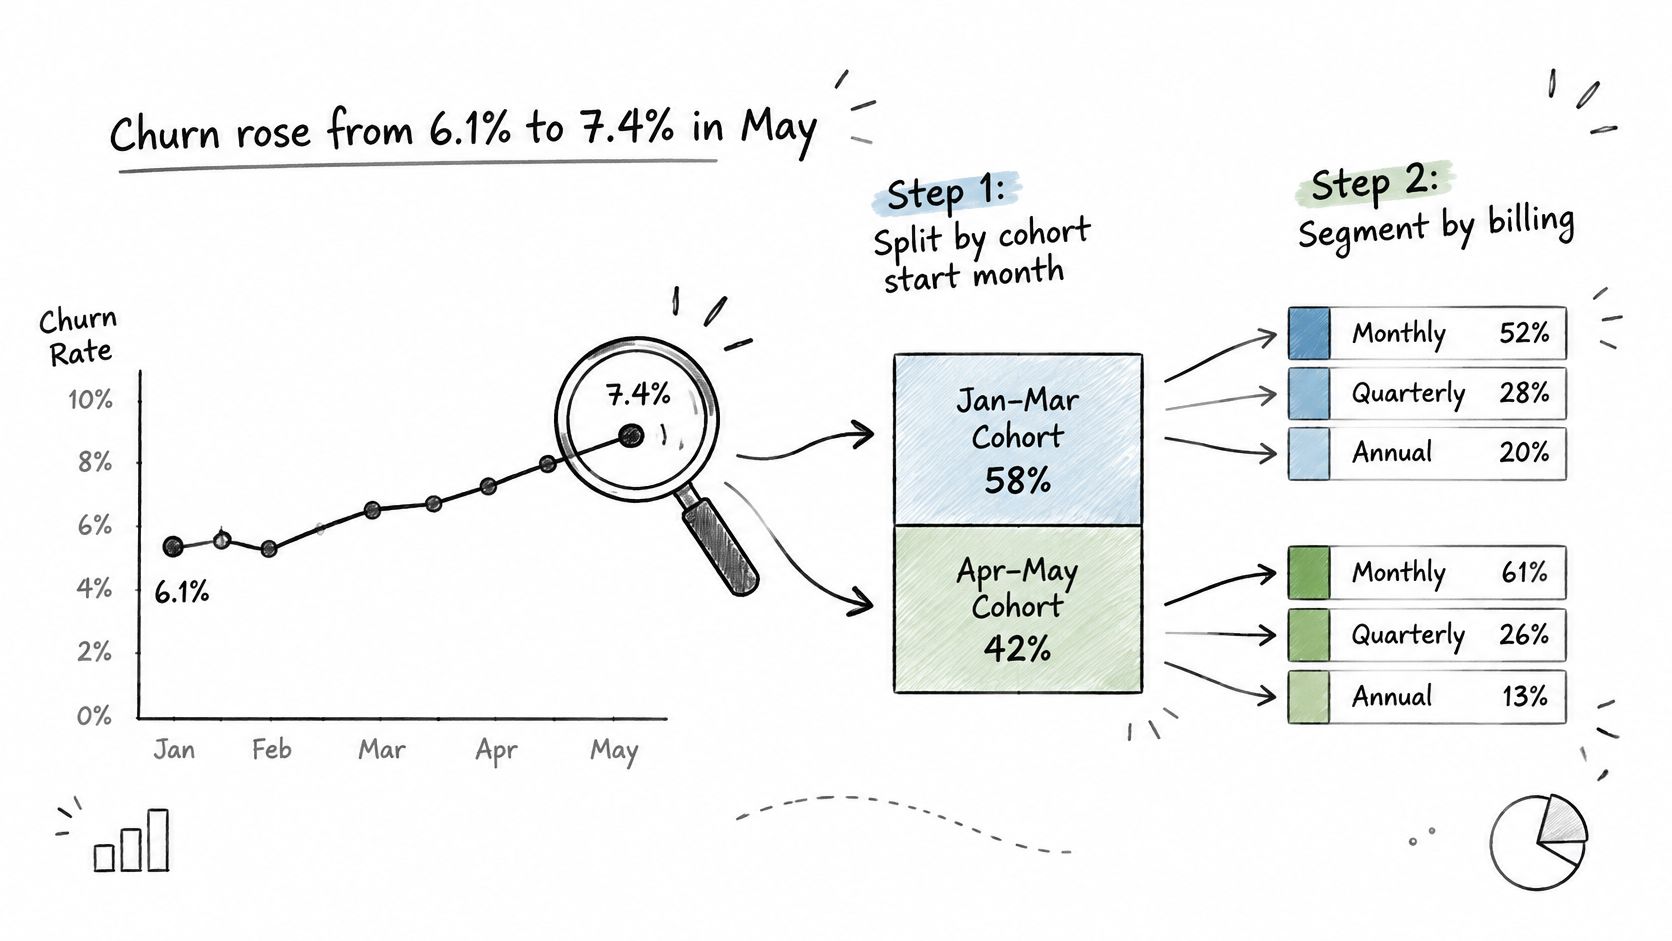
Say a report flags rising churn. The analyst's first task isn't to identify a persuasive explanation, but to narrow the set of explanations that remain plausible.
Start by splitting the result by cohort entry period. If recently acquired subscribers account for the deterioration, investigate their early subscription experience; if established cohorts also worsen, look for changes affecting the broader base.
This sequence keeps the investigation tied to unresolved questions.
Follow each cut with the next question
Cohort entry alone doesn't establish comparability. A newer cohort might contain more monthly subscribers, while an older cohort contains more prepaid or longer-interval subscriptions.
Compare billing intervals next, using equivalent renewal opportunities. Calendar-month retention can conceal differences when subscribers haven't yet reached their next scheduled charge.
Then examine acquisition source within comparable cohorts and intervals. If the decline concentrates in a particular source, inspect the offer, landing-page promise and initial product selection before changing the storewide retention program.
Finally, separate voluntary cancellations from payment-related exits. A subscriber who actively rejects the next shipment needs a different response from someone whose renewal remains unpaid.
Cohort retention by start month
| Cohort | Month 1 | Month 2 |
|---|---|---|
| January | Retained subscribers divided by the original cohort | Apply the same calculation after the next completed observation period |
| March | Compare at the same cohort age as January | Leave unreported until the observation period is complete |
The table describes the calculation and comparison rules rather than inventing performance figures. A subscription cohort analysis workflow should preserve the original cohort denominator and distinguish incomplete observations from actual losses.
A narrower explanation still isn't a cause
Suppose a recent cohort retains less well despite facing the same listed price. That doesn't prove onboarding caused the difference: discounts, acquisition mix, product selection and delivery experience may still differ.
Treat onboarding as a hypothesis to test, not a conclusion obtained by eliminating price alone. Review the relevant journey events and cancellation reasons before designing an intervention.
Segmentation tells you where to investigate. A controlled intervention helps establish whether your proposed fix changes the outcome.
Prediction adds another layer. Skipped orders, failed payments and falling order frequency can become candidate risk signals, but evaluate whether each signal precedes the outcome and adds useful discrimination.
Small cohorts produce unstable percentages, so show counts and uncertainty rather than applying an unsupported universal size cutoff. Recent cohorts require patience because their later renewal outcomes don't yet exist.
The useful output is a testable explanation, an eligible audience and a holdout-based experiment. Define the outcome and evaluation window before launching the treatment, and check margin as well as retained subscriptions.
Choosing Reporting, Analytics or Both by Situation
Use reporting when the question repeats and needs an agreed number. Use analytics when the team needs to explain movement, estimate an outcome or choose an intervention.
Use both when a reported exception triggers an investigation. Name the decision first, then select the starting layer and the deliverable.
Which layer fits which subscription decision
| Situation | Start with | Why | Output |
|---|---|---|---|
| Daily payment recovery queue | Reporting | Needs current counts and retry status | Retry queue with an as-of timestamp |
| Monthly board update | Reporting | Requires consistent definitions across periods | MRR, churn, ARPU and LTV summary |
| Churn increased this month | Analytics | Needs segmentation to investigate the cause | Churn by cohort, interval and acquisition source |
| Choosing which win-back offer to test | Analytics | Requires an experiment with a holdout | Test plan and success threshold |
| Forecasting next quarter's renewal revenue | Both | Needs a reported base plus modeled retention | Forecast with stated assumptions |
Specify what someone will do differently
A payment-recovery report should identify actionable records, not just display the total outstanding balance. Include the renewal identifier, latest payment outcome, next eligible action and suppression status so operations doesn't contact customers whose payments have already recovered.
A win-back analysis should produce an experiment specification rather than a ranked list of offers. State eligibility, exclusions, assignment method, success threshold and margin guardrails before anyone sends the campaign.
A renewal forecast needs a different deliverable again. Show the observed subscription base separately from assumptions about renewals, cancellations, payment recovery and plan changes so finance can challenge the assumptions without disputing the underlying records.
Where the starting rule bends
When definitions remain unsettled, prioritize measurement repair over forecasting. Otherwise, the team carries unresolved discrepancies into inventory purchases, staffing decisions and revenue expectations.
A finance review still needs standardized reporting even when analysts have richer models available. Preserve the approved period view and document adjustments rather than replacing historical figures whenever the analytical method changes.
The appropriate depth also depends on reversibility. A support lead can inspect and correct an individual queue item, while a broad pricing change affects future renewals across the customer base and deserves stronger evidence.
Decision standard: Require more analytical scrutiny when an action is expensive to reverse, even if the dashboard signal looks clear.
Frequency determines how repeatable the output must be. Reversibility determines how much uncertainty the decision-maker should tolerate. Neither is a reason to choose whichever tool looks more advanced.
Tools and Queries for Each Layer
Build around the work each layer must perform. A useful stack can combine an operational interface, a reconciliation workbook, shared dashboards and a warehouse without asking every tool to do every job.
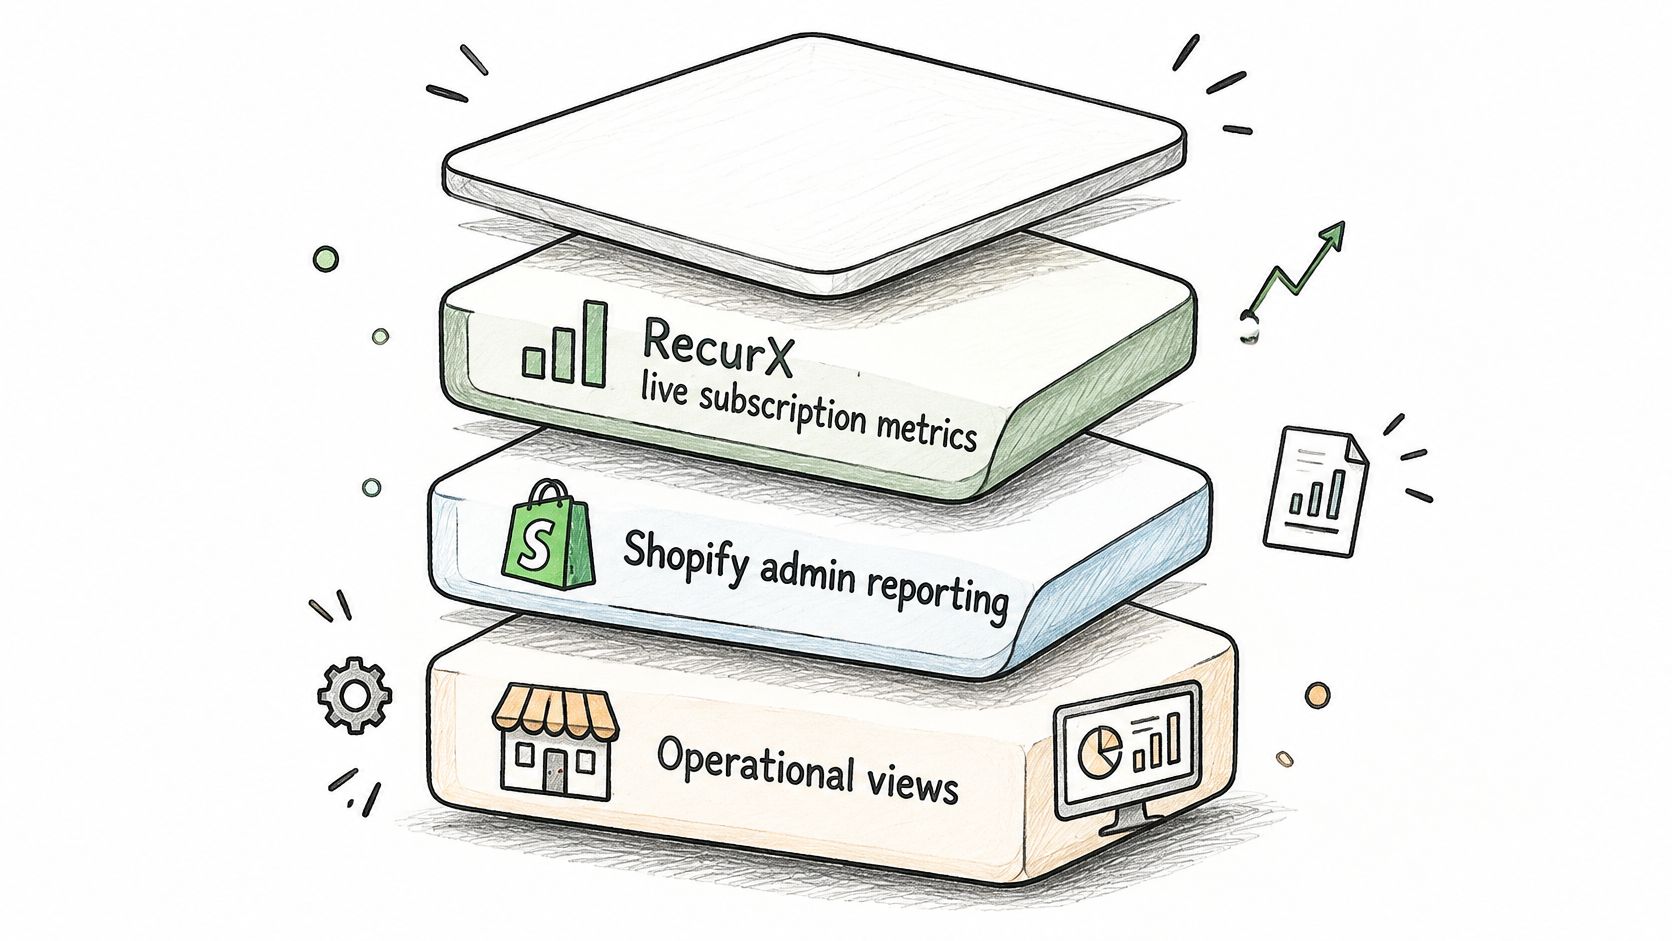
Keep the flow from operational records to analytical outputs visible.
Choose tools by responsibility
- Operational views: Use Shopify admin reporting and the subscription application's current status views for execution. RecurX is one option with live subscription metrics in the admin and built-in cohort, churn and LTV views; confirm plan-level export access before designing a downstream process.
- Reconciliation: Match order, subscription and payment exports in Excel or Google Sheets. Join on stable identifiers, then use pivot tables to inspect period totals and unmatched records.
- Shared dashboards: Connect Looker Studio, Power BI or Tableau to governed metric tables rather than maintaining separate formulas inside each dashboard.
- Investigation: Use warehouse SQL to reconstruct subscription states and compare cohorts, keeping reusable transformations separate from exploratory queries.
A Shopify analytics app evaluation should include data access, historical coverage and metric semantics, not just available charts. Check whether the tool preserves state changes or only exposes today's subscription status.
Translate the question into a query
Monthly MRR: Select subscriptions eligible at the agreed reporting snapshot, normalize each recurring amount to a monthly value, apply the contract's discount and pause rules, and sum separately by currency. Don't add every subscription active at any point in the month, because that mixes opening, closing and intervening states.
Cohort retention: Assign subscriptions to their first renewal month, preserve the original cohort membership, reconstruct activity at each later observation point, and divide retained subscriptions by the starting cohort size. If the business instead defines cohorts by initial order, use that entry rule consistently rather than mixing it with first renewal.
Both queries require historical events or snapshots. Today's status alone can't tell you which subscriptions were active at a past reporting boundary.
Treat freshness as a measurable constraint
The OLTP-to-OLAP freshness benchmark proposal defines freshness through the elapsed time between a transaction commit in the operational store and its visibility to analytical queries. A dashboard refresh button doesn't establish that the underlying transactions have arrived.
Set near-real-time targets for payment recovery and customer-facing subscription state. Cohort and LTV analysis can use hourly or daily refreshes when that cadence fits the decision and the lag is monitored.
Expose the as-of timestamp, source system, refresh interval and late-arriving-data policy. If a pipeline is stale, mark the affected output and prevent operational users from treating it as current.
Build the Reporting Layer Before the Analysis
Build the foundation in a deliberate sequence. Each step should leave behind something another operator can inspect, reproduce and maintain.
- Approve the metric contract. Record the business rules for MRR, active subscribers, churn, failed payments and LTV, with a named owner who can resolve disagreements between finance, retention and operations.
- Publish freshness expectations. Attach an as-of timestamp and refresh interval to each metric so users know which decisions it can support.
- Require reconciliation sign-off. Run record matching, cohort-completeness and exit-classification checks across completed billing periods, keeping an exception log instead of silently correcting unexplained differences.
- Start with a decision. Build the cohort or churn-driver analysis needed for the next retention choice, rather than assembling an exploratory dashboard without an intended action.
- Control definition changes. Review the contract on a scheduled basis and whenever plans, intervals, discounts or retry rules change, preserving version history for period comparisons.
Make the handoff reproducible
Give operators a short acceptance checklist: the published metric matches its approved calculation, its supporting records are accessible, and unresolved exceptions have an owner. Analysts should be able to identify the exact dataset and definition version used for an experiment or forecast.
Keep the operating scorecard small while this process settles. Adding dimensions is useful only when someone can explain how those dimensions were assigned and what decision they support.
For a migration from Recharge, Loop, Bold or Skio, compare churn and MRR for the same period in both systems before cutover. Investigate differences at subscription level, including effective dates, currency handling and paused states, so a reporting change isn't mistaken for a retention change.
Built-in analytical views can provide a starting point, but their labels aren't a substitute for checking the calculation against your contract. The decision rule is straightforward: reporting first while definitions are unsettled, analytics once the numbers reconcile.
RecurX offers Shopify-native subscription management, payment recovery and analytics covering recurring revenue, churn, cohorts and customer value. Visit RecurX to evaluate how those operational and analytical views fit your store's metric contract and retention workflow.
reporting vs analytics · subscription analytics · MRR and churn · cohort retention · ecommerce reporting
Keep reading
- Best Upsell App for Shopify: Top 10 Picks 2026Compare the 10 best upsell app for Shopify options by pricing, placements, subscriptions and loyalty support to find the right fit for your store.
- Quantity Price Breaks for Shopify SubscriptionsSet quantity price breaks on Shopify subscriptions without giving away margin. Compare tiers, Build-a-Box, cart rules, and AOV versus profit.
- Reduce Involuntary Churn on Shopify: 5 Recovery StepsReduce involuntary churn on Shopify with decline routing, card-update flows, retry timing, and measurement that avoids inflated recovery numbers.
Start growing recurring revenue on Shopify
RecurX has a 14-day free trial and zero transaction fees on every plan. Install in minutes.
Start your free trial →